Note
This documentation is for a development version. Click here for the latest stable release (v4.0.0).
A simple harmonic oscillator
This demo implements a simple harmonic oscillator in a 2D neural population. The oscillator is more visually interesting on its own than the integrator, but the principle at work is the same. Here, instead of having the recurrent input just integrate (i.e. feeding the full input value back to the population), we have two dimensions which interact.
[1]:
%matplotlib inline
import matplotlib.pyplot as plt

import nengo
from nengo.processes import Piecewise
Step 1: Create the Model
The model consists of a single neural ensemble that we will call Neurons.
[2]:
# Create the model object
model = nengo.Network(label="Oscillator")
with model:
    # Create the ensemble for the oscillator
    neurons = nengo.Ensemble(200, dimensions=2)
Step 2: Provide Input to the Model
A brief input signal is provided to trigger the oscillatory behavior of the neural representation.
[3]:
with model:
    # Create an input signal
    input = nengo.Node(Piecewise({0: [1, 0], 0.1: [0, 0]}))

    # Connect the input signal to the neural ensemble
    nengo.Connection(input, neurons)

    # Create the feedback connection
    nengo.Connection(neurons, neurons, transform=[[1, 1], [-1, 1]], synapse=0.1)
Step 3: Add Probes
These probes will collect data from the input signal and the neural ensemble.
[4]:
with model:
    input_probe = nengo.Probe(input, "output")
    neuron_probe = nengo.Probe(neurons, "decoded_output", synapse=0.1)
Step 4: Run the Model
[5]:
# Create the simulator
with nengo.Simulator(model) as sim:
    # Run it for 5 seconds
    sim.run(5)
Step 5: Plot the Results
[6]:
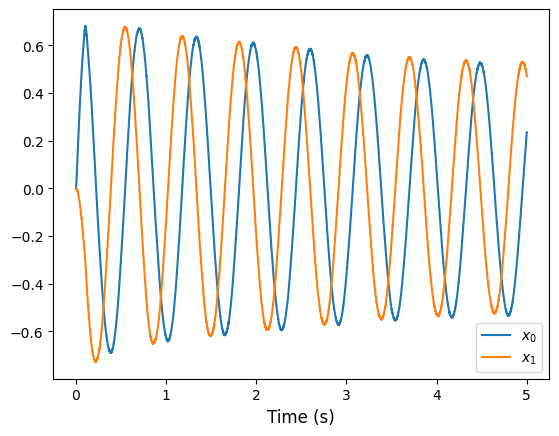
plt.figure()
plt.plot(sim.trange(), sim.data[neuron_probe])
plt.xlabel("Time (s)", fontsize="large")
plt.legend(["$x_0$", "$x_1$"])
[6]:
<matplotlib.legend.Legend at 0x7f4da444d280>
[7]:
data = sim.data[neuron_probe]
plt.figure()
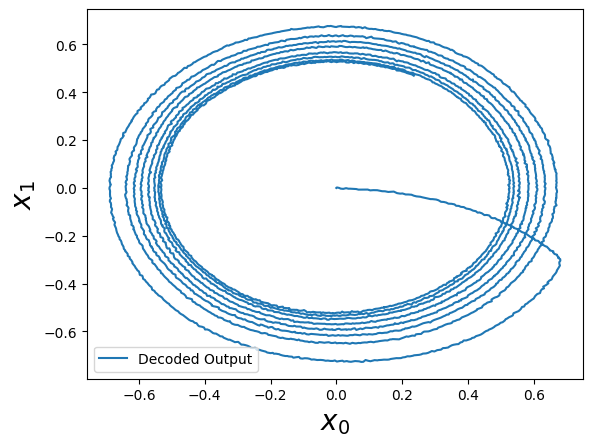
plt.plot(data[:, 0], data[:, 1], label="Decoded Output")
plt.xlabel("$x_0$", fontsize=20)
plt.ylabel("$x_1$", fontsize=20)
plt.legend()
[7]:
<matplotlib.legend.Legend at 0x7f4d625be490>