- NengoLoihi
- Examples
- Communication channel
- Integrator
- Multidimensional integrator
- Simple oscillator
- Nonlinear oscillator
- Neuron to neuron connections
- PES learning
- Keyword spotting
- MNIST convolutional network
- CIFAR-10 convolutional network
- Converting a Keras model to an SNN on Loihi
- Nonlinear adaptive control
- Legendre Memory Units on Loihi
- DVS from file
- Requirements
- License
- Examples
- How to Build a Brain
- NengoCore
- Ablating neurons
- Deep learning
Nonlinear oscillator
This example implements a nonlinear harmonic oscillator in a 2D neural population. Unlike the simple oscillator whose recurrent connection implements a linear transformation, this model approximates a nonlinear function in the recurrent connection to yield oscillatory behavior.
[1]:
import matplotlib.pyplot as plt

%matplotlib inline
import numpy as np

import nengo
import nengo_loihi

nengo_loihi.set_defaults()
Creating the network in Nengo
Our model consists of one recurrently connected ensemble. Unlike the simple oscillator, we do not need to give this nonlinear oscillator an initial kick.
[2]:
tau = 0.1


def recurrent_func(x):
    x0, x1 = x
    r = np.sqrt(x0 ** 2 + x1 ** 2)
    a = np.arctan2(x1, x0)
    dr = -(r - 1)
    da = 3.0
    r = r + tau * dr
    a = a + tau * da
    return [r * np.cos(a), r * np.sin(a)]


with nengo.Network(label="Oscillator") as model:
    ens = nengo.Ensemble(200, dimensions=2)
    nengo.Connection(ens, ens, function=recurrent_func, synapse=tau)
    ens_probe = nengo.Probe(ens, synapse=0.1)
Running the network in Nengo
We can use Nengo to see the desired model output.
[3]:
with nengo.Simulator(model) as sim:
    sim.run(10)
t = sim.trange()
0%
0%
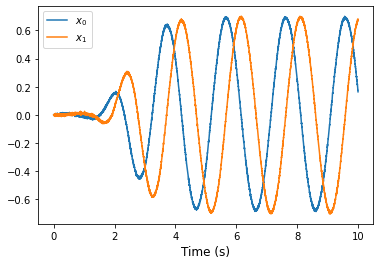
[4]:
def plot_over_time(t, data):
    plt.figure()
    plt.plot(t, data[ens_probe])
    plt.xlabel("Time (s)", fontsize="large")
    plt.legend(["$x_0$", "$x_1$"])


plot_over_time(t, sim.data)
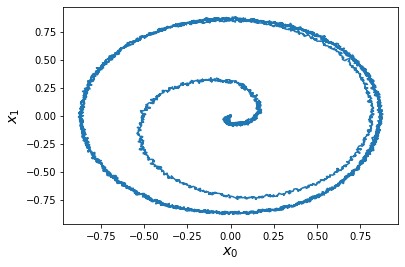
[5]:
def plot_xy(data):
    plt.figure()
    plt.plot(data[ens_probe][:, 0], data[ens_probe][:, 1])
    plt.xlabel("$x_0$", fontsize="x-large")
    plt.ylabel("$x_1$", fontsize="x-large")


plot_xy(sim.data)
Running the network with NengoLoihi
[6]:
with nengo_loihi.Simulator(model) as sim:
    sim.run(10)
t = sim.trange()
/home/tbekolay/Code/nengo-loihi/nengo_loihi/builder/discretize.py:481: UserWarning: Lost 2 extra bits in weight rounding
  warnings.warn("Lost %d extra bits in weight rounding" % (-s2,))
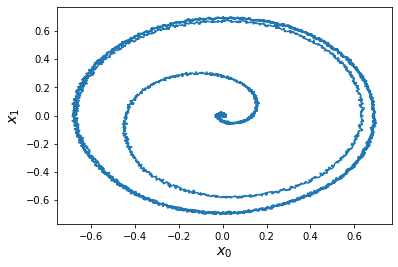
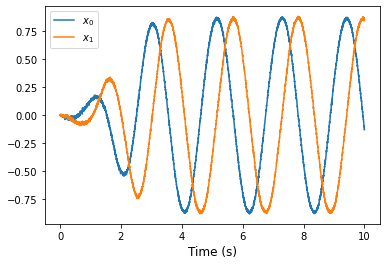
[7]:
plot_over_time(t, sim.data)
[8]:
plot_xy(sim.data)