- NengoLoihi
- Examples
- Communication channel
- Integrator
- Multidimensional integrator
- Simple oscillator
- Nonlinear oscillator
- Neuron to neuron connections
- PES learning
- Keyword spotting
- MNIST convolutional network
- CIFAR-10 convolutional network
- Converting a Keras model to an SNN on Loihi
- Nonlinear adaptive control
- Legendre Memory Units on Loihi
- DVS from file
- Requirements
- License
- Examples
- How to Build a Brain
- NengoCore
- Ablating neurons
- Deep learning
Simple oscillator
This example implements a simple harmonic oscillator in a 2D neural population. Here, instead of having the recurrent input just integrate (i.e. feed the full input value back to the population), we have two dimensions which interact.
[1]:
import matplotlib.pyplot as plt

%matplotlib inline

import nengo
from nengo.processes import Piecewise
import nengo_loihi

nengo_loihi.set_defaults()
Creating the network in Nengo
Our model consists of one recurrently connected ensemble. The ensemble will naturally oscillate, but in order to begin the oscillation we make an input node to give it an initial kick.
[2]:
speed = 1.5  # Slower oscillations may decay to 0

with nengo.Network(label="Oscillator") as model:
    ens = nengo.Ensemble(200, dimensions=2)
    kick = nengo.Node(Piecewise({0: [1, 0], 0.1: [0, 0]}))

    nengo.Connection(kick, ens)
    nengo.Connection(ens, ens, transform=[[1.0, speed], [-speed, 1.0]], synapse=0.1)

    kick_probe = nengo.Probe(kick)
    ens_probe = nengo.Probe(ens, synapse=0.1)
Running the network in Nengo
We can use Nengo to see the desired model output.
[3]:
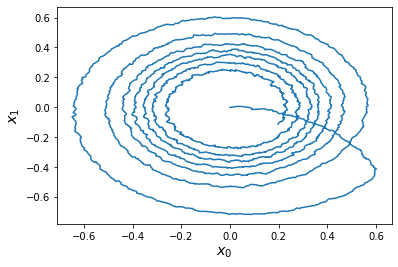
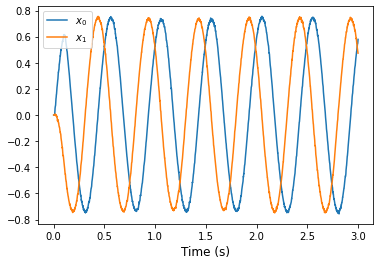
with nengo.Simulator(model) as sim:
    sim.run(3)
t = sim.trange()
0%
0%
[4]:
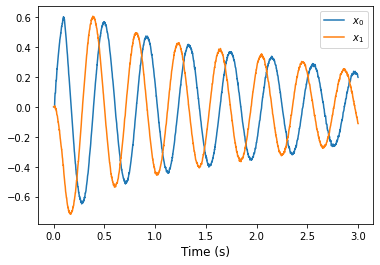
def plot_over_time(t, data):
    plt.figure()
    plt.plot(t, data[ens_probe])
    plt.xlabel("Time (s)", fontsize="large")
    plt.legend(["$x_0$", "$x_1$"])


plot_over_time(t, sim.data)
[5]:
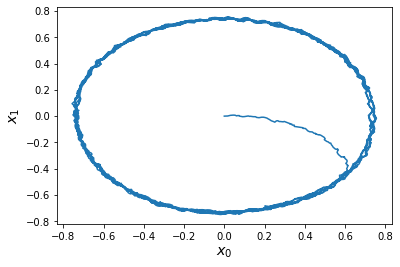
def plot_xy(data):
    plt.figure()
    plt.plot(data[ens_probe][:, 0], data[ens_probe][:, 1])
    plt.xlabel("$x_0$", fontsize="x-large")
    plt.ylabel("$x_1$", fontsize="x-large")


plot_xy(sim.data)
Running the network with NengoLoihi
[6]:
with nengo_loihi.Simulator(model, precompute=True) as sim:
    sim.run(3)
t = sim.trange()
/home/tbekolay/Code/nengo-loihi/nengo_loihi/builder/discretize.py:481: UserWarning: Lost 2 extra bits in weight rounding
  warnings.warn("Lost %d extra bits in weight rounding" % (-s2,))
[7]:
plot_over_time(t, sim.data)
[8]:
plot_xy(sim.data)